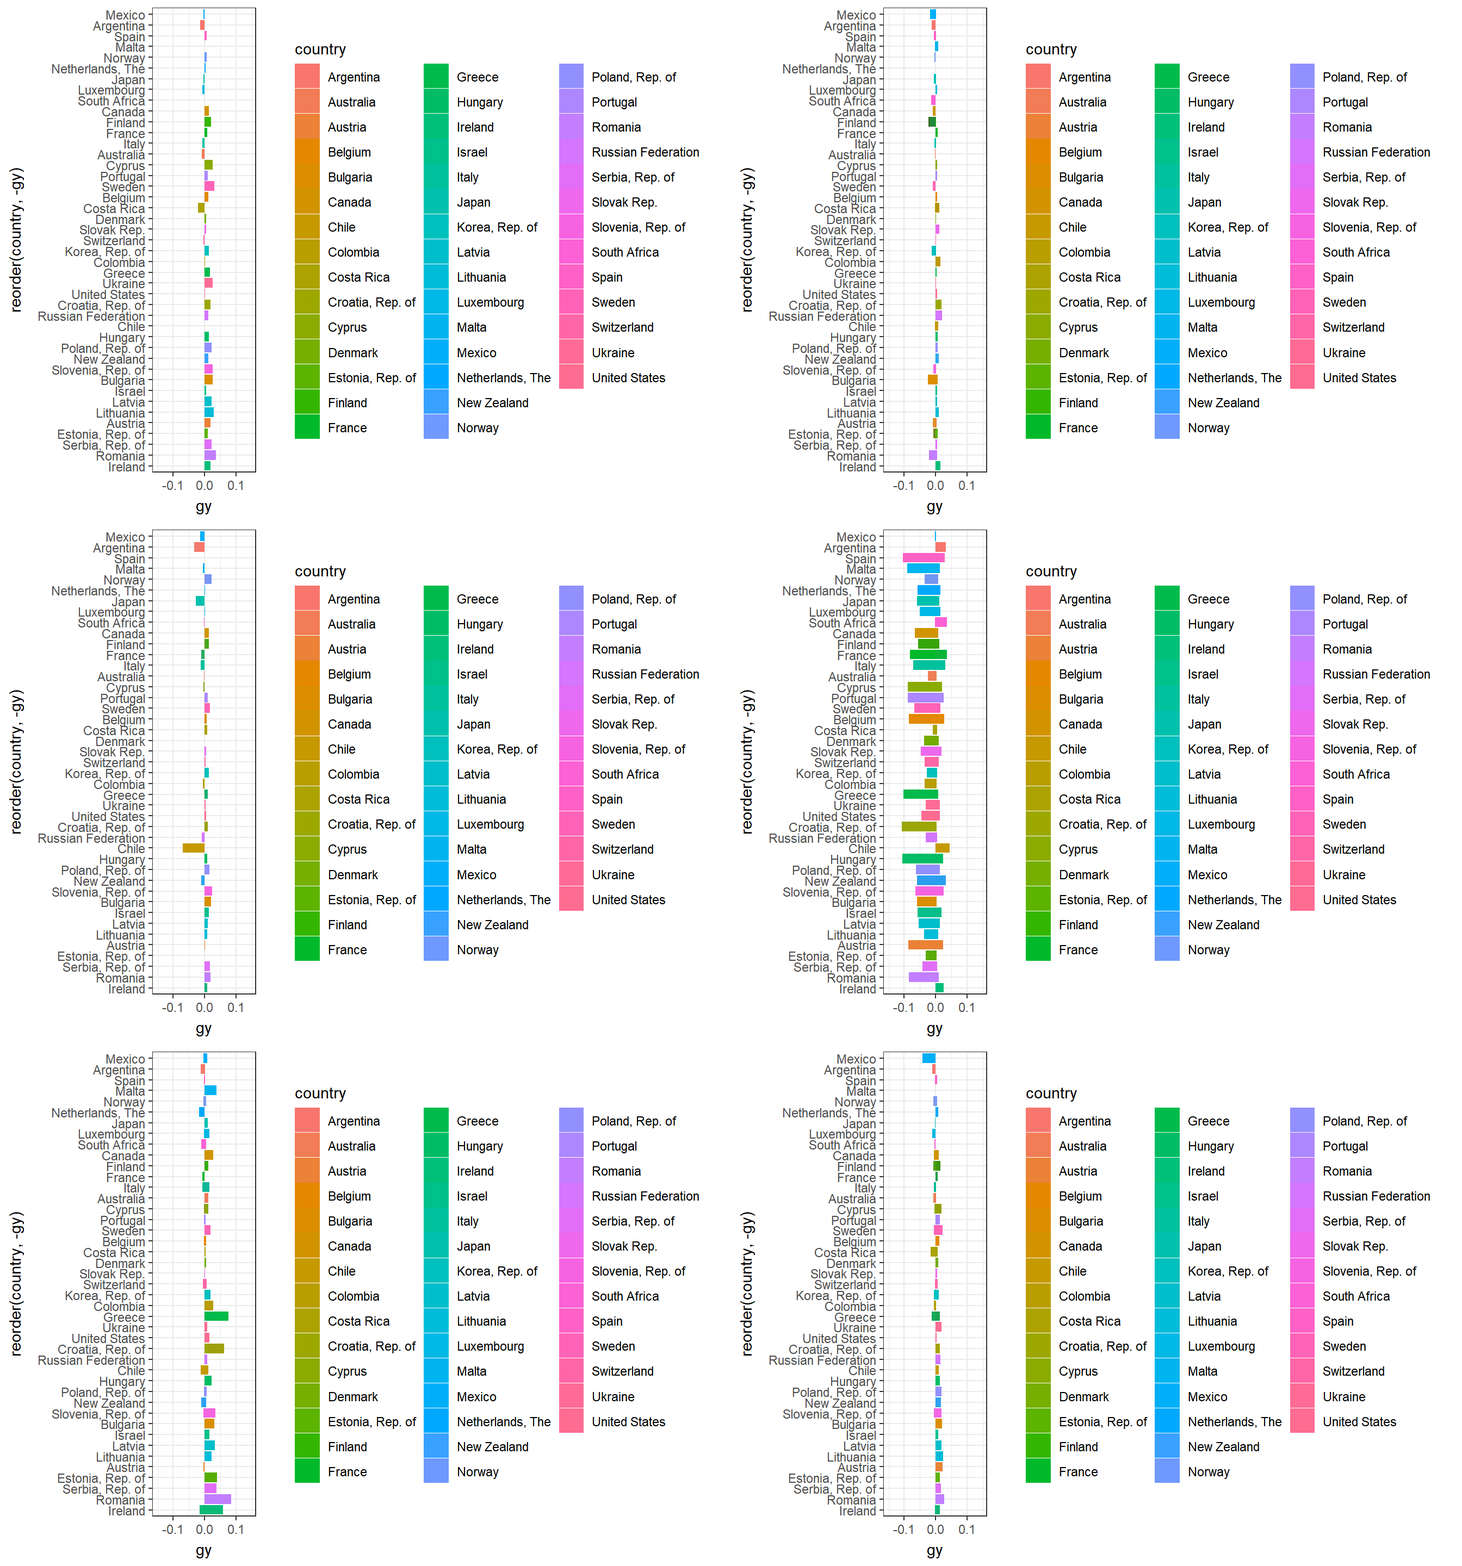
Question 1
imf_growth <- read.csv(url('https://bcdanl.github.io/data/imf_growth_quarterly.csv'))
theme_set(theme_bw())
# install.packages("ggiraph")
# Question 1
anim <- ggplot(imf_growth, aes(x=reorder(country, -gy), y=gy, fill = country)) +
geom_col() + coord_flip() + geom_tile() + transition_states(qt, transition_length = 1)
anim
# animate(anim, 100, fps = 6, width = 1200, height = 800,
# renderer = gifski_renderer())Question 2
climate_opinion <- read.csv(
'https://bcdanl.github.io/data/climate_opinion_2021.csv')
county_map <- county_map
climate_opinion <- climate_opinion %>% filter(belief == "human")
class(climate_opinion$id)## [1] "integer"class(county_map$id)## [1] "numeric"climate_opinion <- climate_opinion %>% mutate(id = as.numeric(id))
county_map <- county_map %>% mutate(id = as.numeric(id))
climate_opinion_full <- left_join(climate_opinion, county_map, by = 'id')
g <- ggplot(climate_opinion_full, aes(long, lat, fill = perc, group = group, text = GeoName)) +
geom_polygon(color = "gray70", size = .05) +
coord_equal()
# g
g2 <- g + scale_fill_gradient2(
low = "2E74C0",
mid = "white",
high = "#CB4541",
na.value = "grey50",
midpoint = 50)
#
# g2
#
map_interactive <- ggplotly(g2)
map_interactive# save the widget
# library(htmlwidgets)
# saveWidget(map_interactive, file=paste0( getwd(), "climate_map_interactive.html"))